To generate an Initiative Dependency Report using VisualScript, you'll need VisualScript installed on your Jira instance.
Once VisualScript is added to your instance, you can add a VisualScript gadget to your dashboard. When the VisualScript gadget is
added to a dashboard, you'll see a list of available reports to run. The built-in reports will be in a folder called "Built-In Reports".
Choose "Jira Initiative Dependency" to add to your dashboard.
Before you can generate the report, there are some parameters you'll need to specify.
- Enter the Issue Key of the Initiative
- Choose the Issue Link Type to show dependencies like "Blocks"
- ParentLink: Choose how an Epic is linked to an Initiative. The default selection is "Relates", but you can also use the "Advanced Roadmaps - Parent Link".
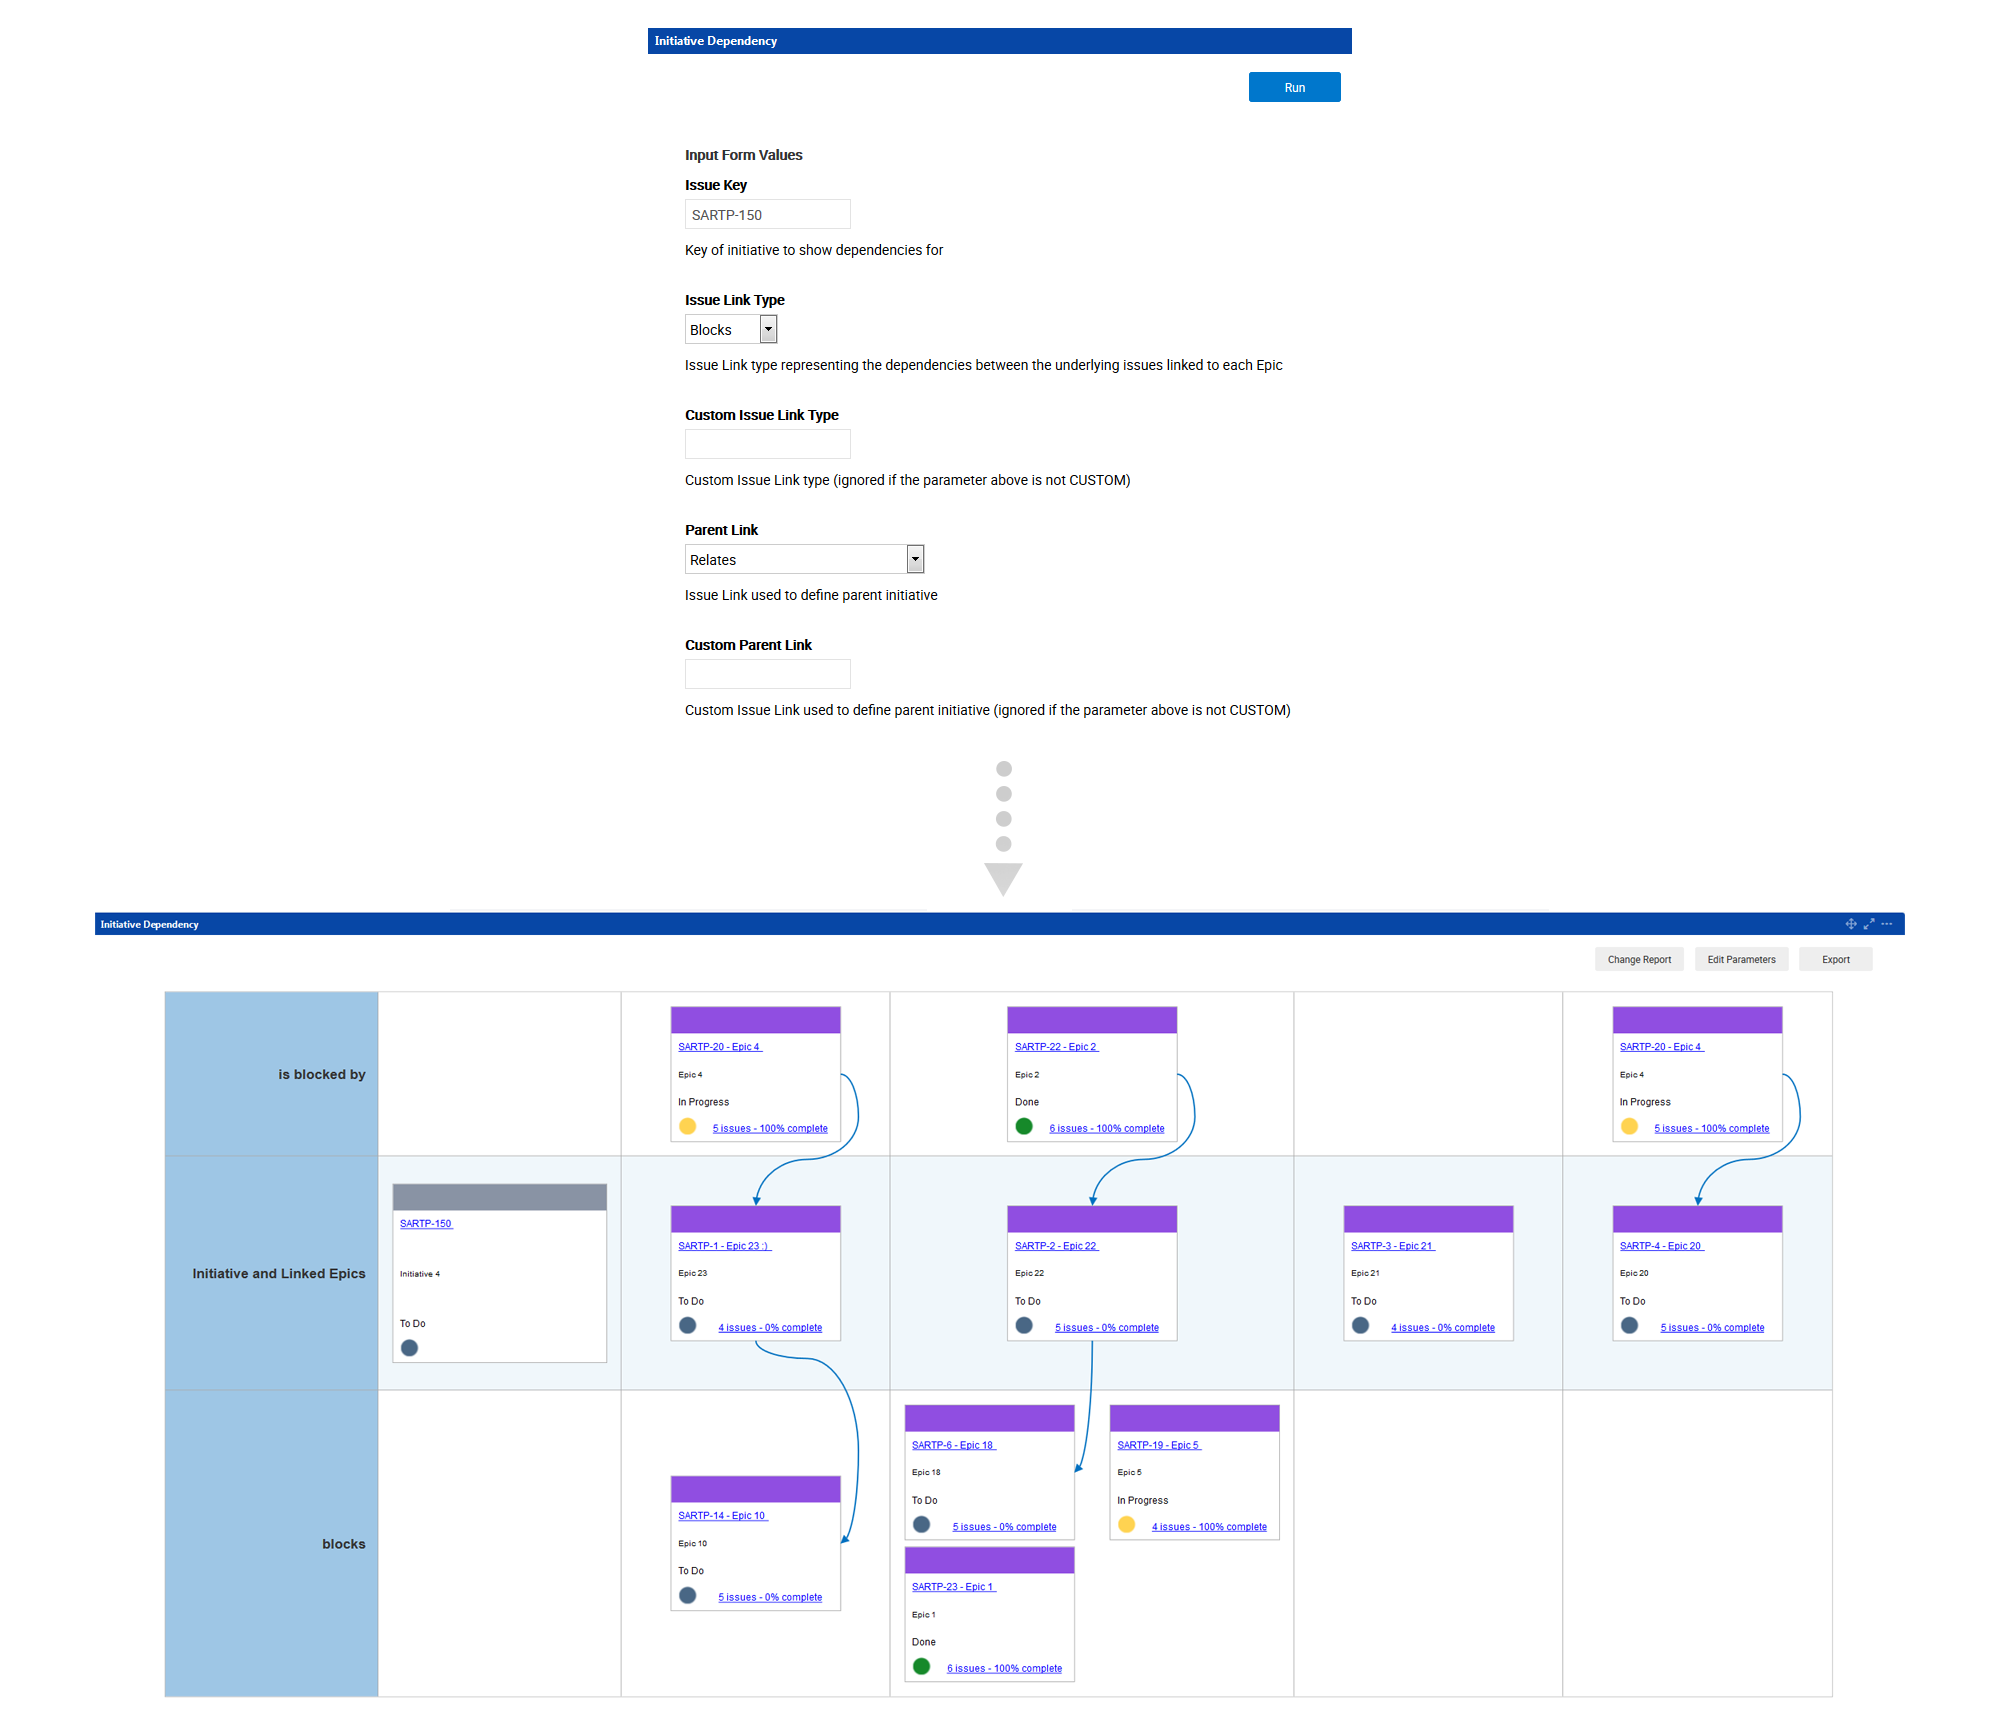
Once the report is generated, you'll see the Initiative in the far left of the center row represented as a gray box on the grid.
The rest of the cards in this center row are the child Epics of that Initiative. On the cards for each Epic, VisualScript also includes
a status indicator: green for done, blue to do, and yellow in progress using the traditional Jira colors. Each Epic is
also hyperlinked to the issue in Jira and shows the number of Stories underneath each Epic and its percentage completion.
The top row shows all the Epics blocking the Epics in the center row of our Initiative. The bottom row shows all the Epics being blocked by the child
Epics of our selected Initiative.
As your organization and SAFe® implementation scales, you need to understand dependencies to continue to make good business decisions.
VisualScript's Initiative Dependency Report will integrate with Advanced Roadmaps (previously Portfolio) and let you see what issues are
linked to any selected initiative and show their dependencies even across different projects.


